


This comprehensive guide explores the sophisticated strategy of liquidity sweep trading within price action analysis. Throughout eight detailed sections, we’ll examine how institutional traders target and sweep liquidity pools, creating predictable patterns you can leverage in your trading. From fundamental concepts to advanced techniques, risk management, and real-world examples, this document provides everything you need to identify, analyze, and profit from liquidity sweeps across any market and timeframe.
T2 Markets
Understanding Market Liquidity and Its Critical Role in Trading
Market liquidity forms the foundation of all price action, representing the ease with which an asset can be bought or sold without significantly affecting its price. In essence, liquidity is where willing buyers and sellers converge, creating transaction opportunities. These liquidity pools become the primary targets for what traders call “liquidity sweeps.”
Liquidity exists in concentrated zones around several key price levels. Stop-loss orders cluster below recent lows for longs and above recent highs for shorts. Limit orders accumulate at obvious support and resistance levels, round numbers, and significant moving averages. Additionally, market participants place orders at Fibonacci retracement levels and pivot points, creating predictable liquidity reservoirs.
The Smart Money Concept
Institutional traders and market makers, often referred to as “smart money,” need substantial liquidity to enter and exit their large positions without excessive slippage. This necessity drives a fundamental market behavior pattern: these large players will often deliberately push prices into areas of high liquidity before reversing direction to execute their actual trading intention.
Why Liquidity Matters
- Institutional traders need liquidity pools to fill large orders
- Retail stop-losses create exploitable liquidity zones
- Market makers profit from predictable retail
behavior - Price extremes often occur when liquidity is
exhausted
Liquidity Providers vs. Takers
- Market makers provide liquidity through limit orders
- Retail traders typically take liquidity with market orders
- Institutions can act as both providers and takers
- Imbalances between providers and takers create market inefficiencies
Understanding order flow dynamics reveals how smart money orchestrates liquidity sweeps. Large players use these sweeps to create short-term price movements that trigger stop losses and panic selling or buying, allowing them to accumulate or distribute positions at favorable prices. By identifying these patterns, retail traders can align themselves with institutional movements rather than becoming their victims.
Identifying Liquidity Zones and Sweep Patterns in Price Action
Successfully trading liquidity sweeps requires the ability to identify potential liquidity zones before they’re targeted. These zones represent areas where orders accumulate and create opportunities for smart money to exploit. By recognizing these patterns early, traders can anticipate price movements and position themselves accordingly.
Key Liquidity Zones to Monitor
1. Recent Swing Highs and Lows
These areas naturally attract stop-loss orders.
Traders going long place stops below recent lows,
while shorts place stops above recent highs. These
concentrated stop clusters create prime liquidity
zones that larger players target.
2. Unfilled Order Blocks
When price moves rapidly through a zone without sufficient trading volume, it creates an imbalance or “order block.” These areas represent unfilled orders and unresolved price discovery, making them magnets for future price revisits.
3. Daily, Weekly, and Monthly Opens
Session opening prices attract significant orders as institutional traders establish positions based on overnight developments. These levels remain relevant throughout the session and create natural liquidity pools.
4. Round Numbers and Psychological Levels
Human psychology creates order clusters around round numbers (. in forex, $ in stocks).
These psychological levels consistently attract
limit orders and stops, making them premium
liquidity zones.
Common Sweep Patterns
Liquidity sweeps manifest in several recognizable patterns. The “stop hunt” occurs when price briefly penetrates a support or resistance level, triggering stop losses before reversing direction. The “spring” pattern shows price dipping below support or rising above resistance before sharply returning to the range, often with increased momentum. “Wicks” or “tails” on candlesticks frequently indicate liquidity being swept, with longer wicks suggesting more aggressive sweeping action.
Volume analysis provides crucial confirmation of sweep activity. A spike in volume during a level breach followed by a price reversal typically confirms a legitimate liquidity sweep. Conversely, sustained high volume after breaking a level may indicate a genuine trend continuation rather than a sweep.
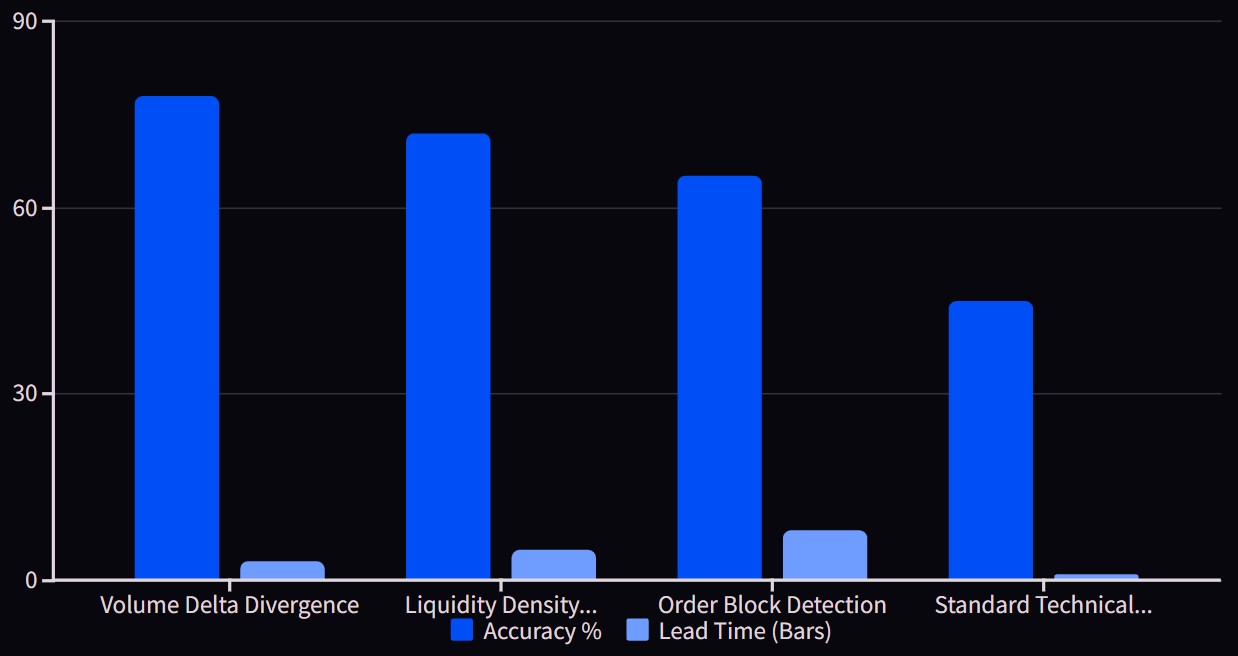
Advanced traders also look for “order flow footprints” that reveal institutional activity. These include absorption (large buying into selling or vice versa), stopping volume (sudden volume spike with price reversal), and delta divergence (price making new extremes with diminishing buying/selling pressure). These subtle clues often precede the more obvious price action signals, giving prepared traders an early advantage.
Technical Entry and Exit Strategies for Liquidity Sweep Trades
Developing precise entry and exit strategies around liquidity sweeps requires both analytical rigor and disciplined execution. While identifying liquidity zones establishes the foundation, effectively capitalizing on sweep opportunities demands a systematic approach to trade management from initial trigger to final exit.
Entry Techniques for Liquidity Sweep Trades
1. The Reversal Confirmation Entry
Wait for price to sweep a liquidity zone and then confirm a reversal with a closing candle in the opposite direction. This approach prioritizes confirmation over early entry, potentially sacrificing some profit for increased reliability. Example: After price sweeps below a recent low, enter when a bullish engulfing candle closes above the low.
2. The Limit Order Anticipation
Place limit orders directly in the liquidity zone, anticipating the sweep and reversal. This method offers better price execution but carries higher risk if the sweep extends further than expected. Example: Place buy limit orders just below a support level where stops are likely accumulated.
3. The Momentum Reversal Entry
Enter as momentum shifts after the sweep, using indicators like RSI divergence or MACD crossovers to time the entry. This balanced approach waits for technical confirmation while still entering relatively early in the reversal. Example: Enter when RSI shows positive divergence after price sweeps below support.
Exit Strategies to Maximize Profit and Minimize Risk
Effective exit strategies for liquidity sweep trades typically involve multiple targets to capture different market scenarios. A common approach uses three exit levels: the first at 1:1 risk-reward to secure partial profits quickly, the second at the next significant resistance or support level, and the third targeting the origin of the previous move or the next major liquidity zone.
Trailing stops provide another powerful exit mechanism for liquidity sweep trades. After the initial reversal confirms your trade thesis, adjust your stop loss to break-even. Then trail your stop behind the developing price action, using techniques like moving the stop behind each new swing low (for longs) or high (for shorts), or utilizing adaptive indicators such as the Chandelier Exit or ATR-based stops.
Time-Based Exit Considerations
Liquidity sweeps often resolve in predictable timeframes relative to the chart you’re trading. On lower timeframes like the 5-minute chart, sweeps typically complete their reversal move within 5-10 candles. On daily charts, the resolution may take 3-5 sessions. Implementing time-based partial exits4taking some profits if your target hasn’t been reached within the expected timeframe4can protect gains from deteriorating market conditions.
Context always modifies execution. In trending markets, favor larger targets after sweeps that align with the primary trend. In ranging markets, target the opposite range boundary after sweeps of range extremes. During high-impact news events, widen your stop loss parameters to accommodate increased volatility while maintaining your strategic position relative to the liquidity zones being swept.
Risk Management Techniques Specific to Liquidity Sweep Trading
Liquidity sweep trading requires specialized risk management approaches that address the unique characteristics of these high-potential, but often volatile trading opportunities. Proper risk control not only preserves capital but also optimizes performance across a series of trades by accounting for the specific risk profile of sweep-based strategies.
Position Sizing Based on Sweep Characteristics
The volatility and potential extension of liquidity sweeps demand adaptive position sizing. While the standard recommendation of risking 1-2% of trading capital per position applies as a baseline, sweep characteristics should further refine this allocation. For sweeps occurring in high-volume market conditions or at major structural levels, considered “high-confidence” setups, position size can approach your personal maximum. Conversely, for sweeps happening during low-volume periods or at minor levels, reduce position size to 50-75% of your standard risk.
The distance required for stop placement also impacts position sizing. Liquidity sweeps often necessitate wider stops to avoid being caught in volatility spikes. Calculate position size using the formula: Position Size = (Account Risk Amount) ÷ (Stop Loss in Pips/Points × Value Per Pip/Point). This ensures that regardless of stop distance, your risk remains consistent across different market conditions.
Strategic Stop Loss Placement
Structural Stop Placement
Place stops beyond the next
significant structure that would
invalidate your trade thesis if
breached. For long positions
after a sweep of lows, this often means placing stops below the lowest point of the sweep, plus a buffer for market noise. This approach protects against false breakouts while giving trades room to develop.
Volatility-Adjusted Stops
Use indicators like Average True Range (ATR) to determine stop placement. A common approach is placing stops at .1.5-2× the current ATR beyond the liquidity sweep level. This adaptive method accounts for each market’s specific volatility characteristics rather than using fixed distances.
Time-Based Stop Management
Implement time-based stop
adjustments to protect against failed reversals. If price fails to show momentum in your favor
within a predetermined period (typically 3-5 candles on the timeframe you’re trading), consider exiting the position even if your stop hasn’t been hit.
The asymmetric risk-reward profile of liquidity sweep trades offers a significant advantage when managed properly. While traditional trading often targets 1:2 or 3:4 risk-reward ratios, sweep trades can realistically achieve 1:4 or greater, as reversals from sweep areas often move significantly and swiftly. This favorable profile allows for a lower win rate while still achieving positive expectancy.
Implementing a tiered exit strategy further enhances risk management. By taking partial profits at predetermined levels (typically 25-30% of the position at each tier), you secure gains while allowing the remainder to capture extended moves. This approach directly addresses the characteristic of liquidity sweeps to sometimes produce explosive momentum after the reversal is confirmed.
Remember that correlated markets require additional risk consideration. When trading liquidity sweeps across multiple instruments that share correlation (such as related forex pairs or stocks in the same sector), reduce your per-trade risk to account for the increased portfolio exposure.
Common Mistakes and Pitfalls Traders Make with Liquidity Sweeps
Even experienced traders can fall victim to several common errors when trading liquidity sweeps. Understanding these pitfalls not only helps you avoid them but also provides insight into market psychology that can improve your overall trading performance.
Misidentifying True Liquidity Sweeps
Perhaps the most fundamental error is confusing genuine trend reversals with liquidity sweeps, or vice versa. Liquidity sweeps typically show specific characteristics: rapid price movement through a level, followed by rejection and reversal within a relatively short timeframe. When a level breaks and price continues moving decisively in the breakout direction with sustained momentum, this likely represents a legitimate trend continuation rather than a sweep. Traders who misinterpret these signals often enter counter-trend positions at precisely the wrong moment.
The solution lies in waiting for confirmation patterns before committing to a position. Look for rejection candles, volume spikes at the sweep level, and initial reversal signals before entering. While this may sacrifice some potential profit, it dramatically improves accuracy in distinguishing between sweeps and breakouts.
Psychological Challenges in Sweep Trading

Fear-Based Decision Making
Many traders experience heightened fear when trading against the immediate price direction during a sweep. This often leads to premature exits when the position experiences initial drawdown, even if the overall setup remains valid. Countering this requires pre-defining your invalidation criteria and committing to them before entering the trade.

Overtrading Perceived Opportunities
The high-reward potential of sweep trades can trigger greed, causing traders to see sweep setups where none truly exist or to risk excessive capital on these opportunities. Implement a pre-trade checklist that requires multiple confirmation factors before entering any sweep trade.

Revenge Trading After Missed Opportunities
The rapid nature of sweep reversals means occasionally missing optimal entries. This frustration often leads to forcing entries on subsequent, lower-quality setups. Combat this by maintaining a trading journal that includes missed opportunities, analyzing them objectively, and developing better triggers for future similar scenarios.
Technical Execution Errors
Poor execution significantly undermines sweep trading results. Common technical mistakes include placing stops too tight, which almost guarantees being stopped out during the volatile sweep phase, or conversely, using stops so wide that risk-reward becomes unfavorable. The balanced approach involves placing stops beyond the structural level that would invalidate your trade thesis, plus a small buffer for market noise.
Another execution error involves improper scaling. Some traders commit their entire position size at once, missing the opportunity to improve their average entry price if the sweep extends further than anticipated. A more effective approach uses scaled entries, placing a portion of the position at the initial signal and additional portions as the sweep develops and shows reversal confirmation.
Finally, many traders fail to adjust their strategies based on market conditions. Liquidity sweeps behave differently in trending versus ranging markets, and during different volatility regimes. During strong trends, sweeps against the trend are less reliable than those in the trend direction. In high volatility periods, sweeps may extend further before reversing. Contextualizing each sweep opportunity within broader market conditions significantly improves trading outcomes.
Advanced Tools and Indicators for Detecting Liquidity Opportunities
While price action alone can reveal liquidity sweeps, sophisticated traders enhance their analysis with specialized tools and indicators that provide deeper insight into market structure and institutional activity. These advanced approaches allow for earlier detection of potential sweep scenarios and more precise trade management.
Volume-Based Analysis Tools
Volume profile analysis stands as one of the most powerful methods for identifying liquidity zones. Unlike traditional volume indicators that show time-based volume, volume profile displays volume at each price level, revealing where the most significant transaction activity has occurred. Areas of high volume concentration often represent fair value zones, while low-volume nodes represent potential liquidity gaps that may be targeted for sweeps.
Cumulative delta indicators track the difference between buying and selling volume over time, helping traders identify absorption 2 when large buying occurs into selling or vice versa. These divergences between price and delta often precede liquidity sweeps as smart money accumulates or distributes positions before engineering a sweep.
Order Flow Analysis
Advanced order flow tools provide insight into the actual transactions occurring at each price level. Footprint charts display buying versus selling pressure within each candle, sometimes color-coded to show imbalances. When a price level shows significant imbalance (much more buying than selling or vice versa), it often indicates institutional positioning that may lead to or follow a liquidity sweep.
Time and sales data, though more granular, offers clues about aggressive buying or selling through large transactions at bid or ask prices. A cluster of large transactions can signal institutional activity preparing for a sweep, especially when occurring at key technical levels.
Market Structure Visualization Tools
Smart money concepts (SMC) tools automatically identify key structural elements like equal highs/lows, liquidity pools, and order blocks. These tools highlight potential sweep targets and can alert traders to untapped liquidity zones that may be swept in future price movements. Similarly, market structure break indicators identify when price breaks previous swing points, often a precursor to liquidity sweeps.
Orderbook heatmaps, available primarily in cryptocurrency and some futures markets, provide real-time visualization of limit order density. These heatmaps directly show liquidity pools where orders cluster, allowing traders to see potential sweep targets in advance and monitor how these orders get filled during market movements.
Custom Indicators and Algorithmic Approaches
Some advanced traders develop custom indicators that combine multiple data points to identify potential sweep scenarios. These might include algorithms that track historical sweep behavior at specific levels, indicators that measure the distance of stops from current price (stop density), or machine learning models trained to recognize patterns preceding successful liquidity sweeps.
Integration of these tools with standard technical analysis creates a powerful framework for sweep detection. By combining traditional support/resistance analysis with advanced volume and order flow tools, traders can both identify potential sweep targets and gauge the probability of a successful reversal trade following the sweep.
Practical Case Studies and Real-World Liquidity Sweep Trading Examples
Examining real-world examples of liquidity sweeps across different markets provides valuable context for implementing the strategies and concepts covered throughout this guide. These case studies demonstrate how the patterns manifest in actual trading conditions and how successful traders capitalize on these opportunities.
Case Study 1: EUR/USD Daily Timeframe Sweep of Monthly Low
In March 2023, EUR/USD had established a clear support zone around 1.0550, tested multiple times without breaking. Institutional positioning data showed commercial traders accumulating long positions while price consolidated above this support. On March 15, price suddenly dropped sharply through this support to 1.0516, sweeping out stop losses before reversing dramatically with a strong bullish engulfing pattern on high volume.
A trader applying liquidity sweep principles would have identified this support zone as a high-probability sweep target due to the obvious stop placement below the multiple touches. The trade execution involved placing limit buy orders at 1.0520, just below the support, with stops at 1.0480. (below the monthly low). The position was managed with a three-tiered exit strategy: 30% at 1.0620 (1:2 risk-reward), 40% at 1.0690 (previous resistance), and the final 30% at 1.0780. The entire move completed within six trading days, demonstrating the powerful reversals that often follow well-executed liquidity sweeps.
Case Study 2: Apple Stock (AAPL) Earnings Gap Liquidity Sweep
Following Apple’s Q4 2022 earnings report, the stock gapped down significantly, creating a large price void with limited trading activity. This gap represented untapped liquidity that remained a magnet for future price action. Three weeks later, during a broader market rally, AAPL approached this gap from below. Institutional order flow data showed significant accumulation despite the approaching resistance.
On December 13, price surged into the gap but then quickly reversed intraday, sweeping the liquidity in the lower portion of the gap before turning down. A trader monitoring this setup would have prepared short positions as price entered the gap, looking for rejection signs. The optimal execution involved waiting for the first sign of rejection4a bearish engulfing hour candle4before entering short positions at $148.30. Stops were placed above the high of the sweep at $150.40, with targets at previous support levels: $142.70, $138.50, and $134.20. The trade reached its final target within eight trading sessions.
Case Study 3: Bitcoin (BTC/USD) Weekend Liquidity Sweep
In July 2023, Bitcoin established a trading range between $29,500 and $31,400. Order book data showed significant stop loss orders clustered below $29,000, creating an attractive liquidity target. Volume decreased while in this range, typical before sweep events.
During weekend trading (known for thinner liquidity), price suddenly dropped through support, reaching $28,600 and triggering cascading stop orders. Volume spiked dramatically at this level, but price failed to continue lower, forming a long-tailed rejection candle.
Within four hours, price reclaimed the original support level with increasing buy volume. Delta divergence indicators showed strong buying despite the price drop, a classic sign of absorption preceding reversal.
Traders entering long positions after the reclaim of $29,500 with stops below $, captured a move to $33,700 over the next two weeks, representing a 1:4.2 risk-reward outcome.
These examples highlight several consistent patterns across successful liquidity sweep trades. First, institutional positioning often provides advance warning, visible through volume analysis and order flow data. Second, the most profitable sweep trades typically occur at significant structural levels that have been respected multiple times previously. Third, sweep reversals tend to move quickly and decisively, allowing for favorable risk-reward profiles even with conservative entry techniques that wait for confirmation.
The case studies also demonstrate the importance of context4market structure, timeframe alignment, and broader trends all influence how sweeps develop and resolve. By studying these and similar examples, traders can develop pattern recognition skills that help identify high-probability sweep opportunities in real-time market conditions.