
This comprehensive guide explores the two primary methods of stock market analysis: fundamental and technical. We’ll examine how these approaches differ in methodology, timeframe, and application, helping investors determine which strategy might work best for their investment goals. From understanding financial statements to interpreting chart patterns, this document provides the essential knowledge needed to make informed investment decisions in today’s complex financial markets.
T2 Markets
What is Fundamental Analysis?
Fundamental analysis is a method of evaluating securities by attempting to measure the intrinsic value of a stock. The fundamental analyst studies everything from the overall economy and industry conditions to the financial condition and management of companies. The end goal is to arrive at a number that an investor can compare with a security’s current price to see whether the security is undervalued or overvalued.
This approach is based on the belief that the market price of a stock tends to move towards its “real value” or “intrinsic value” over time. If the market price of a stock is below its intrinsic value, the investor should buy the stock because the market will eventually recognize its true value and the price will rise. Conversely, if the market price is above the intrinsic value, the fundamental analyst would recommend selling the stock.

Log-Term Perpective
Fundamental analysis typically takes a longer-term view of the market, with investment horizons often measured in years rather than days or weeks.

Deep Research
This approach requires thorough examination of company financials, management strategies, competitive positioning, and macroeconomic factors.

Value-Focused
The primary goal is determining whether a security's current price accurately reflects its true worth based on earnings, growth potential, and assets.
Fundamental analysis can be applied to nearly any revenue-generating entity, including stocks, bonds,
commodities, currencies, and even cryptocurrencies. It is the foundation of value investing, an investment
strategy popularized by Benjamin Graham and practiced successfully by investors like Warren Buffett. While
more time-intensive than technical analysis, proponents argue it provides deeper insight into investment
opportunities and helps identify quality companies with long-term growth potential.
Key Components of Fundamental Analysis
Financial Statement Analysis
The cornerstone of fundamental analysis is the
examination of three primary financial statements: the income statement, balance sheet, and cash flow statement. The income statement reveals revenue, expenses, and profitability over a specific period. The balance sheet provides a snapshot of a company’s assets, liabilities, and shareholders’ equity at a particular moment. The cash flow statement tracks how cash enters and exits the
business, offering insights into operational efficiency and financial health.
Analysts use these documents to calculate key ratios and metrics that help evaluate a company’s financial strength, including:
- Earnings Per Share (EPS) – measures profitability on a per-share basis
- Price-to-Earnings (P/E) Ratio – indicates how
much investors are willing to pay for $1 of earnings - Debt-to-Equity Ratio – evaluates financial leverage and risk
- Return on Equity (ROE) – assesses how efficiently a company uses shareholder investments
Qualitative Factor
Beyond the numbers, fundamental analysis examines qualitative aspects that impact a company’s future prospects:
- Business Model – how the company generates revenue and profit
- Competitive Advantage – sustainable differentiators that protect market share
- Management Quality – leadership team’s experience, track record, and strategy
- Corporate Governance – board composition,
shareholder rights, and ethical practices - Industry Position – market share and competitive
landscape
These qualitative factors help investors understand a company’s potential for sustainable growth and its ability to withstand competitive pressures and economic downturns.
What is Technical Analysis?
Technical analysis is a trading discipline that evaluates investments and identifies trading opportunities by analyzing statistical trends gathered from trading activity, such as price movement and volume. Unlike fundamental analysis, which attempts to evaluate a security’s intrinsic value, technical analysis focuses exclusively on the study of price and volume data as represented in charts and patterns, operating under the premise that historical trading activity and price changes can be valuable indicators of future price movements.

Price-Focused
Technical analysts believe that price contains all relevant information, making fundamental research unnecessary. They assert that all news, corporate fundamentals, economic factors, and market psychology are already reflected in price action.

Pattern Recognition
This methodology is built on identifying recurring patterns and trends in price charts that have historically signaled particular market movements, operating on the assumption that history tends to repeat itself.

Short-Term Oriented
While applicable across various timeframes, technical analysis is particularly popular among short-term traders and active investors looking to capitalize on market momentum and price swings.
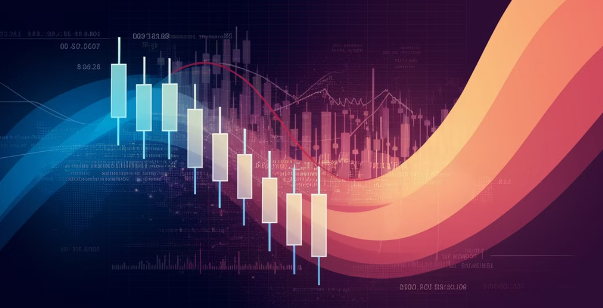
Technical analysis is founded on three key principles: (1) market action discounts everything, meaning all known information is reflected in prices; (2) prices move in trends that persist for appreciable periods; and (3) history tends to repeat itself as market participants consistently react similarly to comparable market conditions. This approach doesn’t concern itself with a company’s financial health or growth prospects, focusing instead on identifying entry and exit points based on mathematical indicators and chart patterns.
While traditional investors might view technical analysis skeptically, its practitioners argue that it provides discipline and objectivity to trading decisions by removing emotional biases. Technical analysis has evolved significantly with technology, with sophisticated algorithms now capable of identifying patterns across multiple markets simultaneously. This approach is widely used by day traders, swing traders, and even some institutional investors seeking to optimize entry and exit points within broader investment strategies.
Essential Tools for Technical Analysis
Chart Types
Charts form the canvas on which technical analysis
is performed. The most commonly used types
include:
- Line Charts – Simple representations connecting closing prices, offering a clean view of overall price movement
- Bar Charts – Display the open, high, low, and close (OHLC) prices for each time period
- Candlestick Charts – Japanese innovation
showing OHLC data with colored bodies indicating bullish or bearish price action - Point and Figure Charts – Focus exclusively on significant price movements while filtering out minor fluctuations
Timeframes for these charts can range from 1-minute intervals for day traders to weekly or monthly views for long-term trend analysis.
Technical Indicator
Traders use mathematical calculations based on
price and volume data to generate objective signals. Key indicators include:
- Moving Averages – Smooth price data to identify trends and potential support/resistance levels
- Relative Strength Index (RSI) – Measures the speed and magnitude of price movements to identify overbought or oversold conditions
- MACD (Moving Average Convergence
Divergence) – Reveals changes in strength,
direction, momentum, and duration of trends - Bollinger Bands – Visualize volatility and potential price boundaries using standard deviations
- Stochastic Oscillator – Compares a security’s
closing price to its price range over a specific period - Volume Indicators – Analyze trading volume to confirm trend strength or signal potential
reversals
Technical analysts also identify specific chart patterns that have historically signaled particular market
behaviors. Common patterns include head and shoulders (indicating potential trend reversals), double tops and bottoms, triangles, flags, and pennants. Support and resistance levels4price points where securities have historically reversed direction4are fundamental concepts for determining entry and exit points. Additionally, specialized theories like Fibonacci retracement levels and Elliott Wave Theory provide frameworks for predicting market movements based on mathematical principles and wave patterns. Modern technical analysis often incorporates algorithmic approaches and machine learning to identify patterns across multiple timeframes and markets simultaneously.
Comparing Fundamental and Technical Analysis
Aspect | Fundamental Analysis | Technical Analysis |
---|---|---|
Primary Focus | Intrinsic value of securities based on financial health and business prospects | Price movements and trading patterns based on market psychology |
Time Horizon | Long-term (months to years) | Short to medium-term (minutes to months) |
Key Data Sources | Financial statements, economic data, industry trends, management quality | Price charts, volume data, technical indicators |
Core Assumption | Markets can misprice securities in the short term but correct over time | Price action reflects all known information and history tends to repeat |
Ideal Application | Long-term investing, value identification, company specific analysis | Market timing, entry/exit point optimization, trend-following |
The philosophical divergence between these methodologies reflects different perspectives on market behavior. Fundamental analysts view the market through a value-oriented lens, believing that securities have an intrinsic worth that can be calculated through rigorous analysis. They assume markets can be inefficient in the short term, creating opportunities for those who can identify mispriced assets. Technical analysts, conversely, often subscribe to the Efficient Market Hypothesis to some degree, believing current prices reflect all available information. Their focus is on identifying patterns in market psychology that tend to repeat over time.
The skill sets required for each approach also differ significantly. Fundamental analysis demands accounting knowledge, financial modeling skills, and business acumen to evaluate competitive positioning and management quality. Technical analysis requires pattern recognition abilities, statistical understanding, and often a more disciplined approach to executing trades based on predetermined rules. While fundamental analysts might spend hours poring over financial statements and listening to earnings calls, technical analysts concentrate on chart formations and indicator signals.
Despite these differences, both methodologies serve the same ultimate purpose: to make profitable investment decisions. Each approach has produced successful investors and traders, and neither can claim universal superiority. The efficacy of either method often depends on market conditions, time horizons, and the temperament of the individual investor or trader. Most successful market participants eventually recognize the value in understanding both perspectives, even if they primarily rely on one approach.
When to Use Each Analysis Method
When Fundamental Analysis Shines
Fundamental analysis typically proves most valuable in these scenarios:
- Long-term investing – When building a portfolio with a multi-year horizon, understanding business fundamentals provides a solid foundation for
identifying companies with sustainable competitive advantages and growth potential. - Value identification – During market corrections or sector-specific downturns, fundamental analysis helps identify financially sound companies trading below their intrinsic value.
- Industry transitions – When technological
changes or regulatory shifts transform
industries, fundamental analysis helps evaluate which companies are best positioned to adapt and thrive. - Income investing – For dividend-focused strategies, analyzing financial stability, earnings consistency, and cash flow generation is essential to identifying reliable dividend payers.
- New offerings – When evaluating IPOs or newly public companies with limited price history, fundamental metrics provide the only substantial basis for valuation.
We Technical Analysis Prevails
Technical analysis often becomes the preferred
approach in these circumstances:
- Market timing – For determining optimal entry and exit points once an investment target has been identified.
- Volatile markets – During periods of high
volatility, technical indicators can help identify overbought or oversold conditions. - Momentum trading – When looking to capitalize on strong price trends in either direction.
- Short-term opportunities – For day trading, swing trading, or position trading with horizons from minutes to weeks.
- Liquid markets – In highly liquid markets like major forex pairs or large-cap stocks where price patterns tend to be more reliable.
- Sentiment analysis – When gauging investor psychology becomes crucial, particularly during market extremes.
Market conditions often dictate which approach might be more effective at a given time. During rational, fundamentally-driven markets, companies tend to trade closer to their intrinsic values, making fundamental analysis particularly effective. However, in emotionally charged markets-whether driven by fear or greed-technical analysis often better captures the psychological factors driving price action. Similarly, in trending markets with clear directional movement, technical tools for trend identification perform well, while rangebound markets might require more focus on fundamental valuations to identify breakout candidates.
Asset class can also influence methodology selection. Stocks with strong earnings visibility lend themselves well to fundamental analysis, while commodities or currencies-which lack “earnings” in the traditional sense-often respond better to technical approaches. Additionally, the market’s time horizon matters: institutional investors with longer timeframes tend to rely more heavily on fundamentals, while retail traders with shorter horizons often prioritize technical signals. The most sophisticated market participants recognize that each method has its place and adapt their analytical approach based on specific circumstances.
Combining Fundamental and Technical Analysis for Optimal Result
Rather than viewing fundamental and technical analysis as competing methodologies, experienced investors increasingly recognize the power of integrating both approaches. This synthesis allows for a more comprehensive market perspective that leverages the strengths of each discipline while compensating for their respective limitations. The strategic combination can enhance decision-making across the full investment process, from idea generation to position sizing and risk management.

Fundamental Screening
Begin with fundamental criteria to identify financially sound companies with attractive valuations and growth prospects

Technical Timing
Use technical analysis to optimize entry points, identify
favorable risk/reward setups, and determine position sizing

Integrated Monitoring
Track both fundamental
developments and technical signals to evaluate position
performance and adjust as needed

Strategic Exits
Utilize technical indicators for tactical exits while considering
fundamental valuation
for strategic profit taking or position reduction
A comprehensive approach might begin with fundamental analysis to identify sectors positioned for growth based on economic trends, then screen for companies with strong financial metrics within those sectors. Once potential investments are identified, technical analysis can determine optimal entry points by identifying favorable price patterns, support levels, or momentum indicators. This prevents the common pitfall of purchasing fundamentally sound companies that continue to decline due to adverse market sentiment or broader technical weakness.
For position management, technical analysis provides objective criteria for implementing stop-loss orders and taking profits, while fundamental analysis offers context for interpreting price movements. For instance, a temporary price decline in a fundamentally sound company might represent a buying opportunity, while the same decline in a company with deteriorating fundamentals could signal the beginning of a larger downtrend. Similarly, when a stock approaches technical resistance levels, a fundamental reassessment can help determine whether the valuation still justifies holding the position.
The integrated approach also provides valuable cross-validation. When both fundamental and technical analyses reach similar conclusions-such as when improving financials coincide with bullish chart patterns-the conviction level for a trade can increase significantly. Conversely, contradictions between fundamental outlook and technical signals warrant deeper investigation and perhaps more conservative position sizing. Ultimately, combining these methodologies acknowledges the complex nature of markets, which are driven by both economic realities and human psychology. By leveraging both perspectives, investors can develop a more nuanced understanding of market dynamics and potentially achieve superior risk-adjusted returns.